
🐍 PCA for portfolio return decomposition
Use scikit-learn's PCA to extract hidden return drivers from stock data
Each week, I send out one Python tutorial to help you get started with algorithmic trading, market data analysis, and quant finance. Upgrade to a paid plan to access the code notebooks.

In today’s post, you’ll use a technique called principal component analysis (PCA) to decompose a stock portfolio into its hidden return drivers, visualize how much each one matters, and see which stocks cluster together.
What PCA actually does
Principal component analysis is a method for taking a dataset with many moving parts and boiling it down to the few that carry the most information.
The idea has been around since the early 1900s, when the statistician Karl Pearson first described it.
It became a workhorse tool in the sciences and eventually made its way into finance, where analysts realized that dozens of stock returns often move together because of a small number of shared forces.
How professionals use it
Today, PCA is a standard part of how trading teams at large firms understand what’s really driving their portfolios.
A portfolio manager with 100 stocks doesn’t analyze each one in isolation.
Instead, they run PCA to find the two or three statistical patterns that explain most of the portfolio’s movement.
Those patterns might correspond to things like overall market direction, interest rate sensitivity, or sector-specific trends.
Once you know which pattern is doing the heavy lifting, you can decide whether you want more or less exposure to it.
Some firms go further and build trading strategies around these patterns, buying stocks with the strongest connection to a particular driver and selling those with the weakest.
Why this matters for you
If you’re just getting started, PCA gives you a concrete way to answer the question “what’s actually moving my portfolio?”
Instead of guessing whether your stocks are truly diversified, you can measure it.
You’ll see exactly how much of your portfolio’s behavior comes from a single dominant force versus genuinely independent movements.
That kind of clarity helps you avoid the trap of thinking you’ve spread your risk when you haven’t.
It also builds a foundation for more advanced work later, like building strategies that target specific return drivers or hedging out the ones you don’t want.
Let’s see how it works with Python.
Library installation
Install all required libraries for downloading market data, running PCA, and visualizing the results.
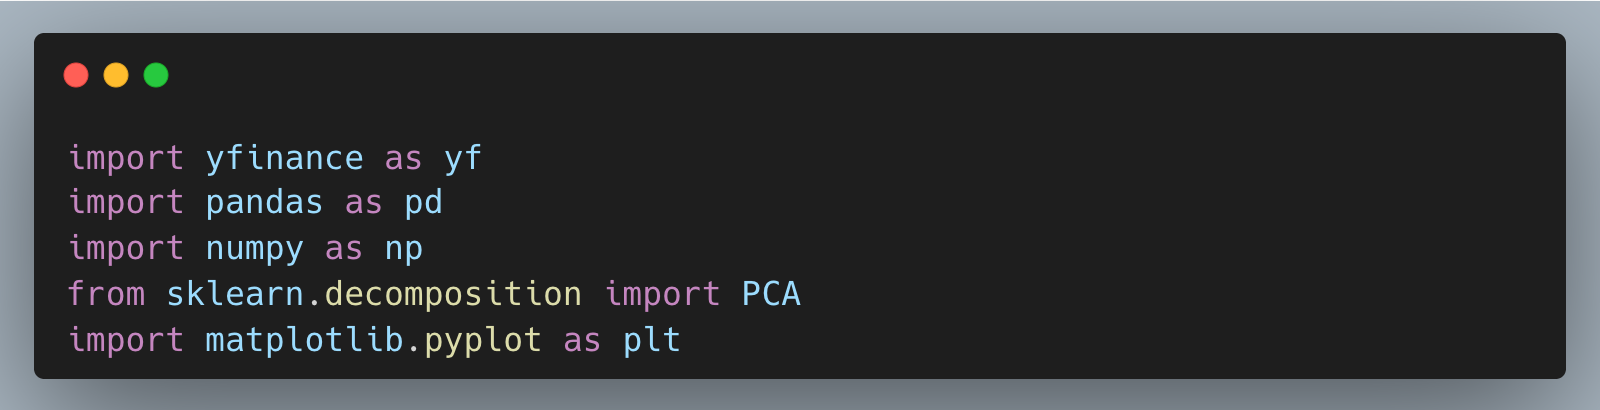
Imports and setup
We use yfinance to pull historical stock prices, pandas and numpy for data manipulation and linear algebra, scikit-learn’s PCA class to extract hidden return drivers, and matplotlib to visualize the results.
Download stock data and compute returns
We define a mixed portfolio of tech stocks and gold miners, then download their daily closing prices and convert them to percentage returns. This is the raw material PCA will decompose into hidden drivers.
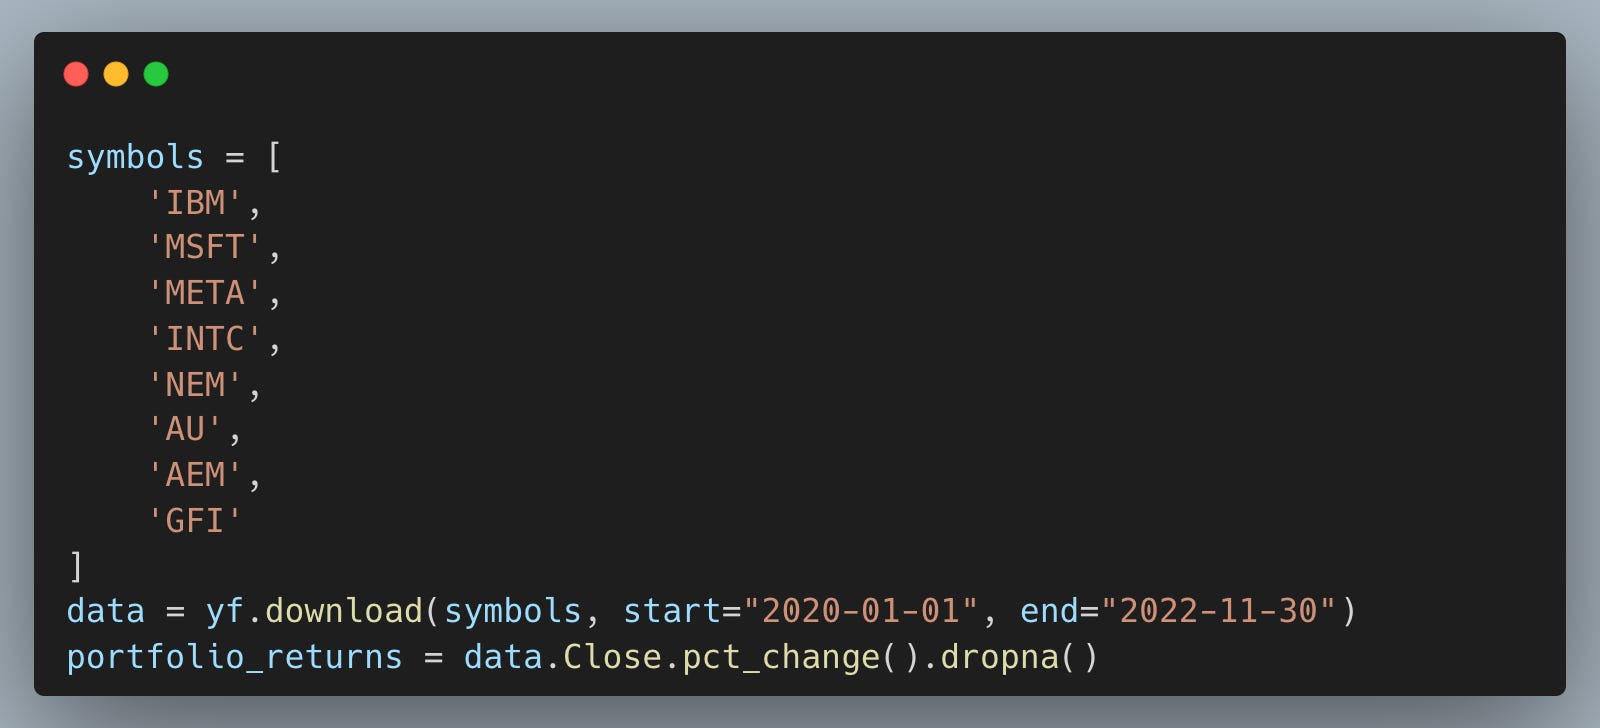
The portfolio deliberately mixes two sectors that seem unrelated on the surface. PCA will reveal whether these stocks actually move independently or share common forces underneath. Working with percentage returns rather than raw prices ensures we compare movements on the same scale.
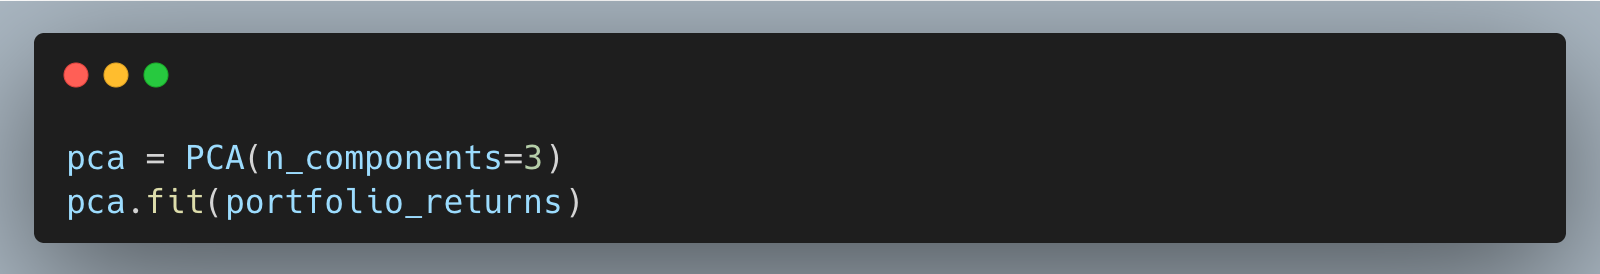
Fit PCA and visualize explained variance
We fit PCA with three components to find the top three statistical drivers of our portfolio’s returns. Three is a practical starting point since most equity portfolios are dominated by just a few forces.
Extract how much variance each component explains and the component weight vectors themselves. These two outputs are the core of the entire analysis.
The explained variance ratio tells us what fraction of total portfolio movement each hidden driver accounts for. If the first component explains 50% or more, it means a single force (often broad market direction) dominates our supposedly diversified portfolio.
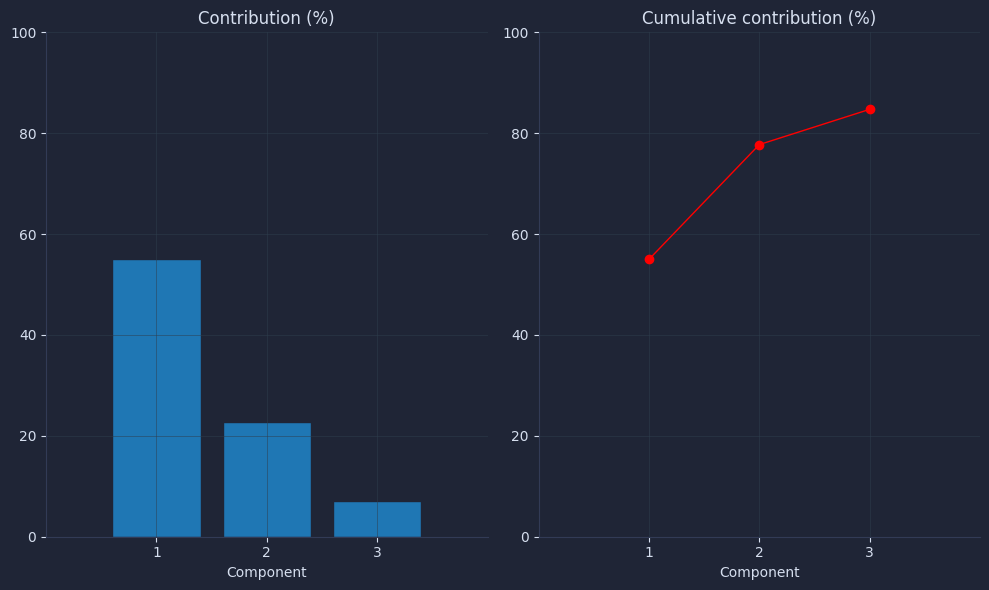
Plot individual and cumulative variance contributions side by side so we can see at a glance how concentrated the portfolio’s risk drivers are.
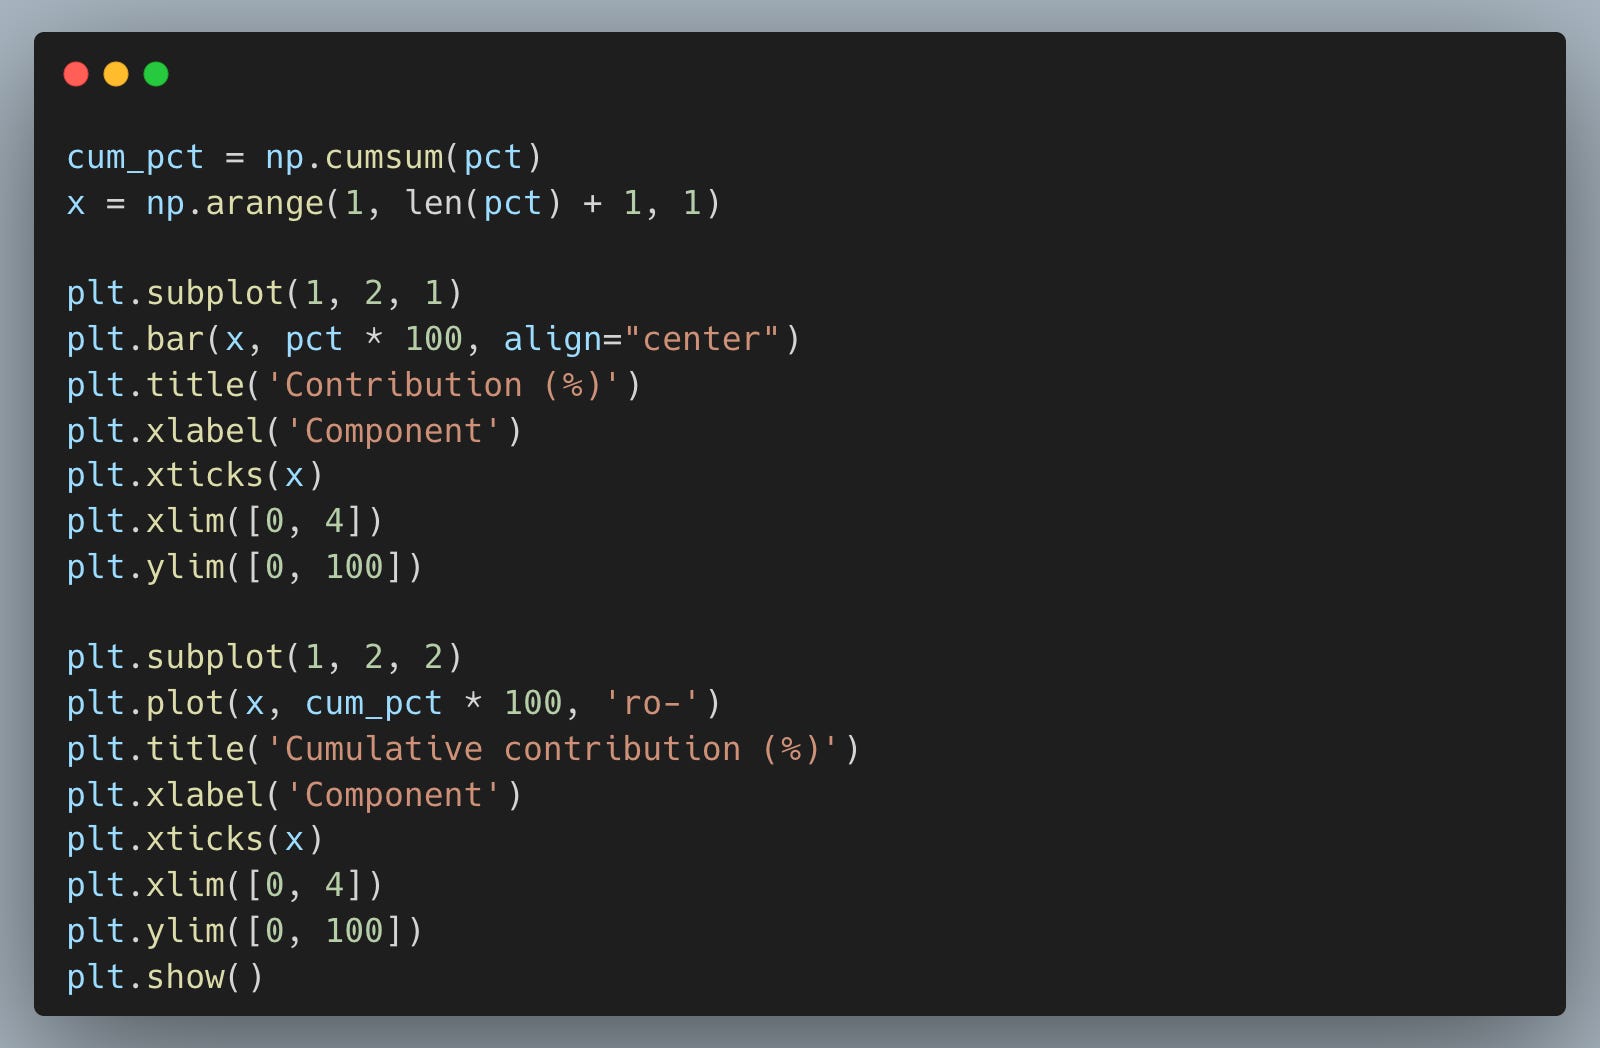
The result is the following chart.

The bar chart shows each component’s standalone contribution while the line chart shows the running total. If the cumulative line reaches 70–80% by the second or third component, it confirms that only a few hidden forces explain most of what our eight stocks are doing. This is the quantitative answer to “am I actually diversified?”
Compute factor returns and exposures
Project the original daily returns onto the principal components to get a daily time series for each hidden factor. This transforms our eight-stock return matrix into three factor return streams.
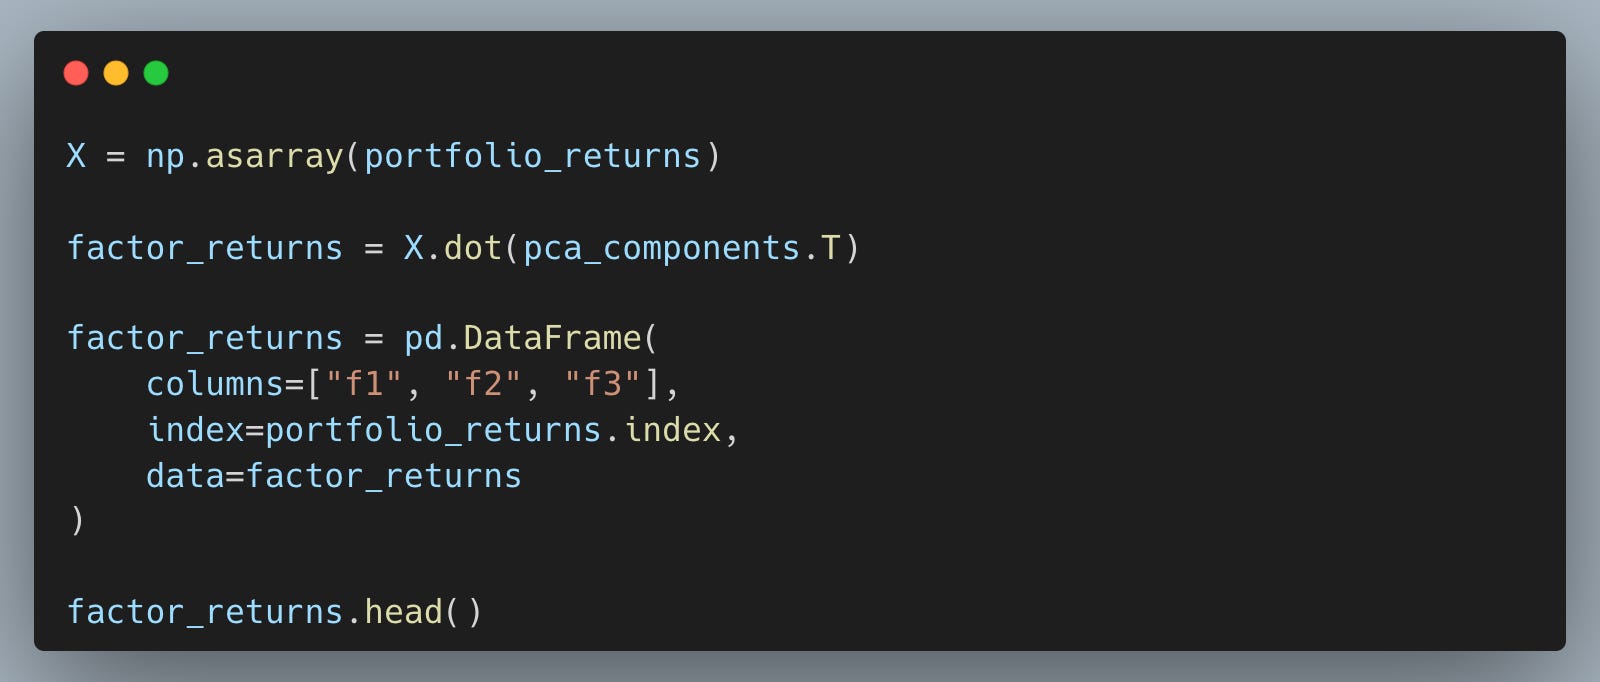
Each row in factor_returns represents how much each hidden driver moved on a given day. Professionals use these synthetic return series to track regime changes, build hedges, or attribute portfolio performance to specific drivers rather than individual stock picks.
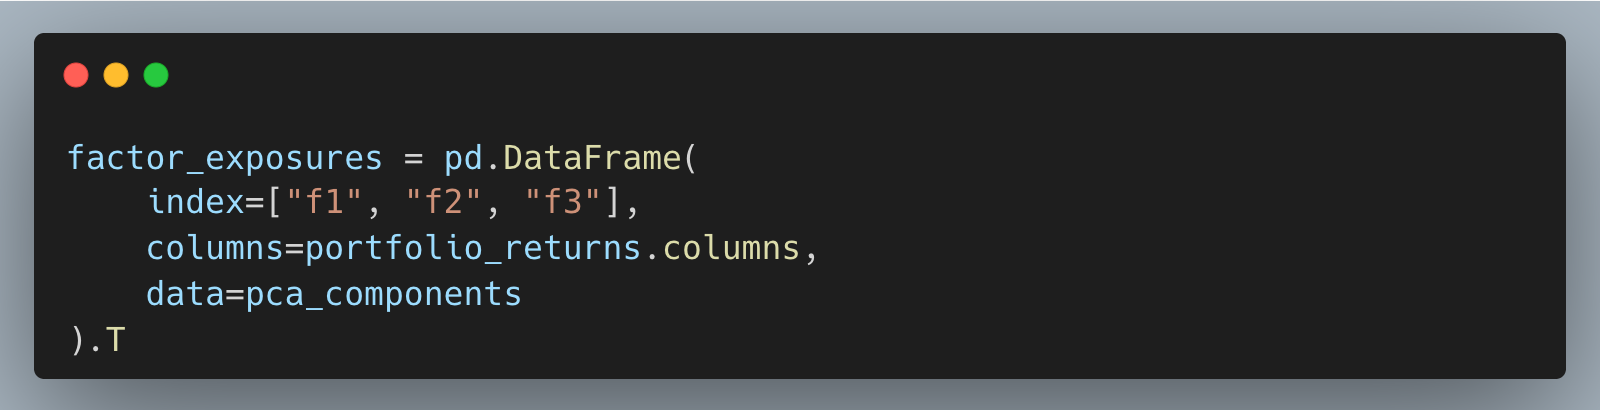
Reshape the component weights into a stock-by-factor table so we can see how strongly each stock loads onto each hidden driver.
Plot each stock’s loading on the first principal component. Stocks with similar bar heights are being pushed around by the same dominant force.
The result is the following chart.
The sorted bar chart makes it easy to spot which stocks respond most (and least) to the portfolio’s primary driver. If all bars point the same direction with similar magnitude, our “diversified” portfolio is really just one big bet on a single force. Stocks with opposite signs would genuinely offset each other.
Map stock clusters with a scatter plot
Plot each stock’s exposure to the first two components on a 2D scatter plot. Stocks that land near each other share similar sensitivities to the top two hidden forces, meaning they tend to move together.
The result is the following plot.

This scatter plot is the payoff of the entire analysis. Tight clusters reveal stocks that look different on the surface but behave the same underneath. If the tech names group together and the gold miners form a separate cluster, we have genuine diversification along at least one axis. If everything collapses into one blob, we know our portfolio is less diversified than we thought and we can take concrete steps to fix it.
Your next steps
You now have a concrete way to decompose your portfolio into its actual return drivers instead of assuming your stocks are independent. That measurement is the difference between real diversification and the kind that disappears the moment you need it most.